Historical drilling at the Raney Gold Project focused on identifying near-surface gold mineralization along an extensive alteration zone. Three sub-parallel and closely spaced mineralized zones of quartz-carbonate alteration with quartz veining, pyrite, pyrrhotite, and occasionally visible gold were outlined. The drilling to date suggests the possibility of steeply plunging shoots of mineralization with reasonable widths in a broad alteration zone that is open along strike.
Previous exploration on the Property from 1972 to 1991 consisted of prospecting, mapping, sampling, trenching, winkie drilling, ground geophysics, stripping, and some limited diamond drilling. This was followed by exploration work during the 2009 to 2010 period. The best intercept returned from historical drilling was 6.5 g/t gold over 8.0 metres.
The property is underlain by mafic volcanics to the north, and felsic to intermediate volcaniclastics to the south. The felsic volcaniclastics are host to the gold zones. Quartz feldspar porphyry dykes and sills and minor mafic intrusives occur throughout the Property. The porphyries are generally massive but may be sheared and hydrothermally altered and veined in places.
A 100 metre-wide intensely sheared and altered quartz-feldspar porphyry body is located just to the south of the main Raney gold showing. Gold mineralization exposed on the surface and intersected in drill holes on the property is typical of the lode gold class of gold deposit which is the dominant gold deposit type in the Abitibi Greenstone Belt. Gold mineralization on the property is associated with the intensely sheared and altered zones within the felsic tuffs, and higher grades tend to occur where quartz veining is present.
The Property is in the Archean Swayze Greenstone Belt, thought to be the southeast extension of the Abitibi Greenstone Belt, which hosts the world-class Timmins and Kirkland Lake gold districts. Numerous gold occurrences occur throughout the district and several world-class mines have been developed. These deposits are responsible for a significant portion of the world’s cumulative gold production and are often characterized by gold enriched quartz vein systems associated with supracrustal belts in low to medium grade metamorphic terranes. Gold mineralization at the Property is typical of the mesothermal lode gold deposit model.
Rockridge holds a 100% interest in the Raney Gold Project.
Exploration in the area is documented from 1932 onwards, and consisted of at least five previous exploration campaigns by companies and prospectors. The Property is part of the Swayze area, which is one of Ontario's historic gold areas and has seen prospecting activities for a variety of metals. There are numerous recent discoveries of gold mineralization within the belt supporting the fact that the district has a rich mineral endowment typical of the Abitibi Orogenic Belt. A nearby past producing gold mine in the Swayze greenstone belt is the Jerome Mine, located southeast of the Property in Osway Township. There are numerous occurrences close to the Property that are undeveloped prospects, with no known reserves. Newmont opened the Borden Mine located ~35 kilometres to the west in 2019.
The earliest documented exploration on the Property was by the Raney Lake Prospecting Syndicate in 1932. A group of 35 claims northeast of Raney Lake was staked, prospected and explored by selective trenching and sampling. Two high-grade (l opt Au) gold-bearing quartz veins were discovered and exposed during this program. The first quartz vein, the “No. 1 showing” was striking easterly and dipping steeply north, and was traced for 100 feet with a maximum width of 2 feet. Host rocks were indicated as arkose and/or impure quartzite. The vein contained minor pyrite and carbonate, native gold was noted in one spot. A second quartz vein, the “No. 2 showing”, was exposed 500 feet southwest of the No. 1 showing. It strikes N60E, was exposed continuously for 100 feet, and averaged 6 inches in width. Host rocks were feldspar porphyry which contained trace pyrite, chalcopyrite, and galena. Native gold was observed in one place. These two veins were originally referred to as the “Thorne-Greaves gold showing” (Furse, 1932).
In 1972, J-Dex Exploration Limited staked 4 claims containing the two gold-bearing veins. Most of the property they worked is south of the present day Raney Property, near the north shore of Denyes Lake. The claims lapsed, but were later staked in 1978 by D.O. Baker. One Winkie drill hole, with a length of 66 m (218 feet), was drilled in the vicinity of the No. l showing (Baker, 1979). The location of this hole is uncertain and no assay results are available.
J-Dex Mining and Exploration acquired claims over the gold showings in 1978, and performed geophysics consisting of a magnetometer and VLF-EM survey. This was followed up with geological mapping and sampling (Caira and Coster, 1984). Assays up to 34.0 g/t Au were reported from the surface sampling. In 1984 a limited Winkie drilling program was completed, totaling 11 drill holes for 615 m (2,017 feet). Seven holes were positioned at three collar locations to test the No. l gold showing. These holes generally cut the vein zone at very shallow depths. Intersections included 4.79 m of 2.16 g/t Au and 2.36 m of 1.21 g/t Au. Four holes were positioned at a single collar location to investigate VLF-EM anomalies located to the northwest of the vein (Caira, 1984). The No. 2 gold showing was not tested during this program.
In 1986 J-Dex Mining and Exploration formed a joint venture with Goldrock Resources and Glen Auden Resources, and they extended the original J-DEX claims to a 72 claim property. Induced Polarization, magnetic, VLF-EM and lithogeochemical surveys were completed over 15 km of grid covering a portion of the present property (Hodges, 1986). The surveying did not include the swampy area immediately to the east of the No l showing.
In 1988 a drilling program was performed to test the IP anomalies, as well as some magnetic anomalies and structures associated with the No. 2 gold showing. A total of thirteen Winkie holes were completed, totaling 375.82 m (1233 feet). Many of the planned targets were never intersected and thus untested. Assay values were not submitted for the drill core samples. The No. l gold showing was not tested in this program (MPH Consulting, 1993).
In 1991 a prospector staked several claims which form part of the current property. The prospectors cleaned out the old trenches over the No. 1 and No. 2 showings, performed sampling of these showings, and completed geological mapping (Salo, 1992). Assays were not reported.
In 1993 Cree Lake Resources Corp. optioned the property and carried out a program of geological mapping, rock sampling and till sampling over a larger group of claims which included most of the present day property. Rock sampling confirmed previously indicated values. A soil geochemistry survey outlined a broad zone of weakly anomalous gold-in-soils over the No. 2 gold showing. The soil program did indicate the No. 2 gold showing had the possibility of some strike extension. The geochemical anomaly over this showing is coincident with IP chargeability anomalies defined during previous exploration and is largely untested (MPH Consulting, 1993). A compilation program by Cree Lake Resources interpreted a gold-bearing alteration envelope surrounding the No. l auriferous quartz vein, and suggested the vein zone was increasing in intensity and potential to the east. Recommendations for a drilling program to test both gold showings were made, however the company did not have the funds to implement the program and no further work was recorded by Cree Lake Resources. In 1993, Induced Polarization surveys were reported to have been completed over portions of the current property, the data has not been located in assessment files.
In 1999 Joe-Anne Salo and William Brereton completed one drill hole on the property; this program was funded by the Ontario Prospectors Assistance Program (OPAP). A total of 251 m (823ft) was drilled on the projected east extension of the historic No. l gold showing. Two zones of irregular quartz-carbonate flooding, patches and veinlets with minor disseminated pyrite were intersected from 127 to 134 m and 148 to 159.5 m. The upper zone returned assay results of 2.50 g/t Au over 1.0 m, while the lower zone assayed 3.37 g/t Au over 6.8 m (Brereton, W., 1999). During this same period of work limited stripping work was carried out over the No. 2 showing. A strong, wide (100 m) shear zone was mapped with white weathered feldspar porphyritic rocks. Systematic sampling was not carried out at this time, further drilling was recommended.
In 2005 Wallbridge Mining Company Ltd. evaluated the property, they compiled previous work and re-logged and sampled the 1999 drill hole. The best assay returned from this sampling was 3.85 g/t Au over 5.9 m within the lower gold zone or No. 2 showing (Oosterman, 2005).
Hinterland Metals Inc. optioned the property in 2007, and from the end of 2007 to mid-2008 completed four drill holes totaling 758 m (Fekete and Simper, 2008). Three of the drill holes tested the No.1 showing, and one of these, RAN07-02, was lost at 99.1 m. The other two drill holes were successful in intercepting two mineralized gold zones over the Main showing. The best results were 2.76 g/t Au and 0.51 g/t Ag over 15.5 m in hole RAN08-04 from the lower zone and 1.62 g/t Au and 0.27 g/t Ag over 1.5 m in hole RAN08-03 from the upper zone. The fourth drill hole tested the No. 2 showing, and did not intercept any mineralization. The drill core is still available, and some of it was re-sampled by MPH Ventures in 2009. The report of work is documented by Fekete and Simper (2008) and a review of this document indicates that industry best practices of standards were employed during the program. No further work was carried out by this company; recommendations included magnetometer and IP surveys, sampling, followed by 6000 m of drilling.
Table 2: Raney Township Gold Property Previous Drill Holes (pre-2020) - Significant Results
| Hole | Azimuth | Dip | Length m | From m | To m | width m | Au g/t | Company | |
| DL-1 | SSW | -60 | 66.45 | 45.72 | 46.02 | 0.30 | 3.77 | D.O. Baker | |
| 49.07 | 50.29 | 1.22 | 1.71 | ||||||
| 84- 15WA |
210 | -45 | 64.92 | 44.78 | 45.72 | 0.94 | 0.41 | J-Dex | |
| 84- 15WB |
210 | -70 | 60.05 | 17.81 | 17.98 | 0.18 | 5.45 | J-Dex | |
| 45.26 | 46.28 | 1.01 | 1.20 | ||||||
| 49.51 | 51.82 | 2.31 | 1.21 | ||||||
| 84- 15EA |
210 | -45 | 74.68 | 12.19 | 13.36 | 1.17 | 0.650678 | J-Dex | |
| 24.38 | 25.60 | 1.22 | 0.341 | ||||||
| 53.93 | 54.25 | 0.33 | 0.232 | ||||||
| 84- 15EB |
210 | -67 | 65.84 | 19.81 | 22.02 | 2.21 | 4.54 | J-Dex | |
| incls | 21.03 | 21.34 | 0.31 | 28.77 | |||||
| 36.70 | 38.10 | 1.40 | 1.54 | ||||||
| 43.59 | 46.94 | 3.35 | 0.89 | ||||||
| 84- 30EA |
210 | -45 | 56.69 | 7.42 | 12.19 | 4.78 | 2.54 | J-Dex | |
| incls | 10.13 | 11.28 | 1.14 | 5.76 | |||||
| 49.89 | 50.90 | 1.01 | 0.96 | ||||||
| 84-30EB | 210 | -65 | 60.66 | 10.24 | 14.94 | 4.70 | 0.76 | J-Dex | |
| incls | 10.24 | 11.84 | 1.60 | 1.03 | |||||
| incls | 13.77 | 14.94 | 1.17 | 1.17 | |||||
| 15.90 | 16.15 | 0.25 | 1.37 | ||||||
| 84- 30EC |
190 | -65 | 55.17 | 4.57 | 6.10 | 1.52 | 1.51 | J-Dex | |
| 8.15 | 9.14 | 0.99 | 6.31 | ||||||
| 19.64 | 20.98 | 1.34 | 1.68 | ||||||
| R-99-1 | 180 | -60 | 251.00 | 153.00 | 159.80 | 6.80 | 3.37 | W. Brereton | |
| incls | 153.00 | 155.25 | 2.25 | 4.81 | |||||
| incls | 157.40 | 159.80 | 2.40 | 5.04 | |||||
| RAN08- 03 |
180 | -75 | 251.00 | Upper | 202.90 | 204.40 | 1.50 | 1.62 | Hinterland |
| incls | 202.90 | 203.70 | 0.80 | 2.20 | |||||
| Lower | 222.50 | 225.50 | 3.00 | 2.05 | |||||
| incls | 224.50 | 225.50 | 1.00 | 6.04 | |||||
| RAN08- 04 |
180 | -50 | 208.00 | Upper | 80.20 | 86.20 | 6.00 | 0.80 | Hinterland |
| incls | 81.20 | 82.20 | 1.00 | 2.09 | |||||
| Lower | 109.70 | 125.20 | 15.50 | 2.76 | |||||
| incls | 109.70 | 111.40 | 1.70 | 13.77 |
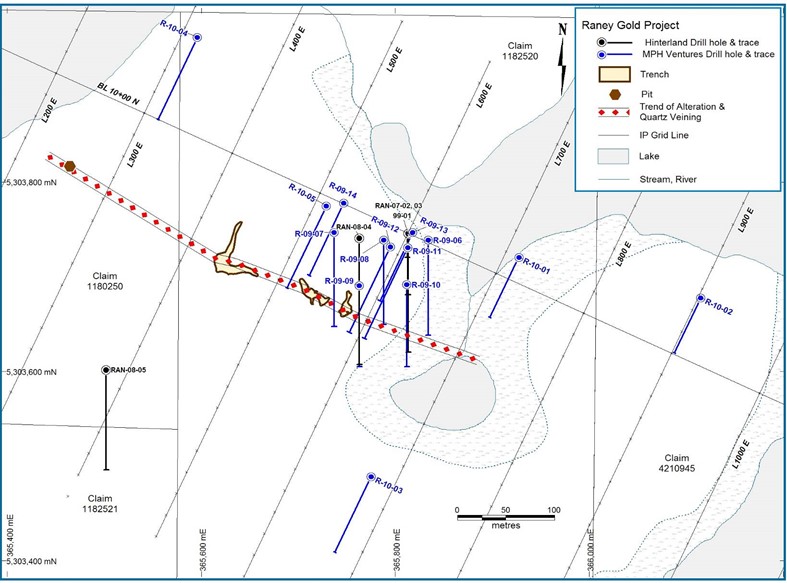
Plan of 2007, 2008, 2009 and 2010 Drilling Showing Mineralization Trend
MPH Ventures conducted trenching and sampling, Induced Polarization (IP) surveys, followed by drilling over the Property during the winter of 2009 and 2010. This phase of exploration is discussed below in further detail.
Nine holes were completed in 2009 in three phases by MPH Ventures to follow up on gold-bearing drill intersections in holes 99-01, RAN-08-03, and RAN-08-04.
The first phase of the program involved the completion of three drill holes to test the extent of gold mineralization 25 metres to the east (R-09-06) of hole 99-01, 25 metres to the west (R-09-07) of hole RAN-08-04, and to provide an intersection between the 50 m spacing (R-09-08) of holes 99-01 and RAN-08-04.
Holes R-09-06 and R-09-07 returned anomalous but low gold results over variable widths. Hole R-09-08 returned 7.44 g/t Au over 6.5 metres, and established a 50 metre strike length for gold mineralization, extending from hole 99-01 to RAN-08-04.
The next phase of drilling tested the dip potential of this 50 metre trend. Drill hole R-09-09 and R-09-10 tested the gold mineralization in the up dip direction. The two holes intersected anomalous gold mineralization over narrow widths, the highest grade was 1.1 g/t Au over 2 metres in hole R-09-10.
During the next phase of drilling a larger grid was cut, oriented perpendicular to the known mineralization, such that the zone would be intersected perpendicular to the strike direction of mineralization, alteration, and shearing. Four holes (R-09-11 to R-09-14) were completed, testing the down dip continuity of the alteration zone. Significant gold mineralization was intersected in three of the four holes, and it is important to note that each hole intersected multiple alteration zones which contained mineralization. This recognition of multiple zones and better grades is thought to be a result of drilling the zones perpendicular to their strike and dips. The best intersection was in hole R-09-011 consisting of 3.73 g/t Au over 4.0 m. Drill hole R-09-14 intersected 1.43 g/t Au over 2.25 m, and this hole extended the known mineralization 100 m west of the original discovery. Several sections follow which demonstrate the results of the 2007-2008 Hinterland drilling and the 2009 MPH drilling. Section 5+50 E shows the mineralized zone intersected in holes R-09-07 and R-09-14. This zone is very steeply dipping. Section 6+00 E cuts through the main mineralized showing, and demonstrates that at least two and possibly three parallel mineralized zones are present. Section 6+50 E extends the mineralized zones to the east.
Table 3: Significant Results from 2009 Drilling
| DDH | From | To | Width | Au g/t |
| R-09-06 | 67.75 | 68.8 | 1.05 | 0.93 |
| R-09-06 | 119.5 | 127.0 | 7.5 | 1.66 |
| Incls | 125.0 | 127.0 | 2 | 2.88 |
| R-09-06 | 135.5 | 136.6 | 1.1 | 2.71 |
| R-09-07 | 103.5 | 104.5 | 1 | 0.41 |
| R-09-08 | 121.0 | 127.5 | 6.5 | 7.44 |
| Incls | 124.5 | 125.5 | 1.0 | 37.6 |
| R-09-08 | 137 | 139 | 2 | 2.12 |
| R-09-08 | 143 | 144.5 | 1.5 | 0.65 |
| R-09-09 | 45 | 46.5 | 1.5 | 0.63 |
| R-09-09 | 110 | 111 | 1 | 0.40 |
| R-09-10 | 54.5 | 56.5 | 2 | 1.11 |
| R-09-10 | 57.5 | 58.5 | 1 | 0.69 |
| R-09-10 | 119 | 119.7 | 0.7 | 0.62 |
| R-09-11 | 57 | 61 | 4 | 3.73 |
| R-09-11 | 97 | 105 | 8 | 1.57 |
| Incls | 97 | 99 | 2 | 3.42 |
| Incls | 103 | 105 | 2 | 2.16 |
| R-09-11 | 167.8 | 168.8 | 1 | 1.33 |
| R-09-12 | 95 | 97.25 | 2.25 | 2.85 |
| R-09-12 | 166 | 168 | 2 | 2.74 |
| Incls | 167 | 168 | 1 | 5.29 |
| R-09-14 | 112.3 | 113 | 0.7 | 0.83 |
| R-09-14 | 177.5 | 179.75 | 2.25 | 1.43 |
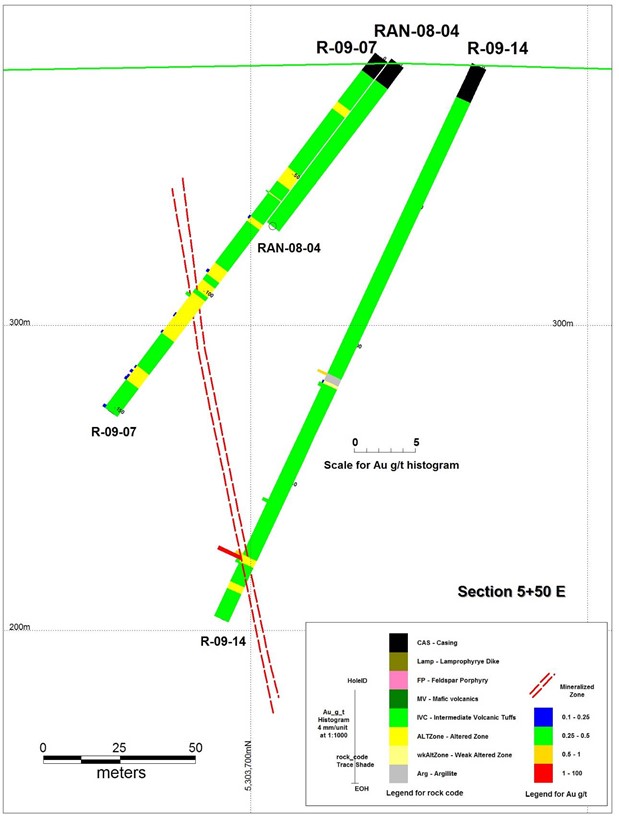
Figure 6: Section 5+50 E (Kettles, 2011)
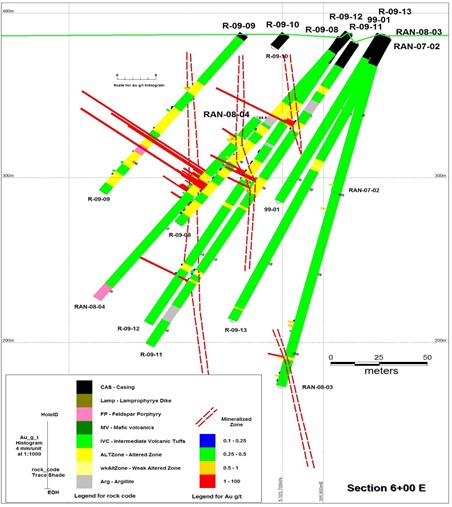
Figure 7: Section 6+00 E (Kettles, 2011)
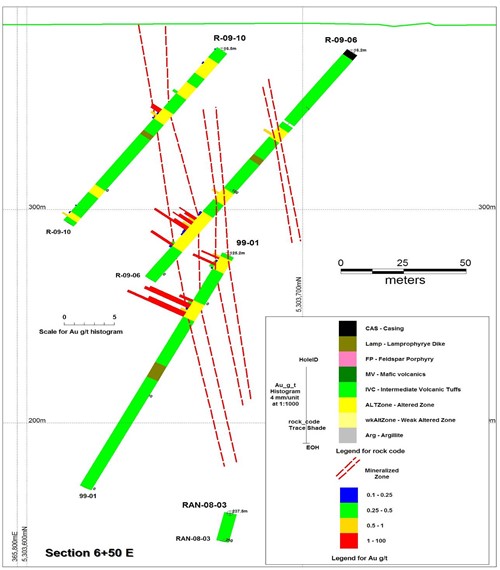
Figure 8: Section 6+50 E (Kettles, 2011)
The ground IP survey results were used to plan the drilling in 2010. This drilling was designed to test the east and west extensions of the sheared alteration zone and to evaluate the geophysical anomalies. Five holes were completed, totaling 645 m.
Hole R-10-01 was planned to test the extension of the Raney gold structure 100 metres east of the previous drilling, and to test an IP anomaly outlined on L7+00 E. This hole intersected numerous gold intercepts over narrow widths including 18.85 g/t Au over 0.40 metres, 7.08 g/t Au over 0.75 metres, 3.67 g/t Au over 1.0 metre, and 2.85 g/t Au over 1.0 metre. The drilling confirms the eastward continuity of the structure. The other four holes did not intersect significant gold mineralization but sufficiently explained the geophysical anomalies. Hole R-10-05 tested the west extension of the mineralization, and intersected narrow anomalous gold assays. The best intersection was 0.61 g/t Au over 1.0 m. This hole had several narrow intercepts of anomalous gold, and may suggest the zone has narrow gold-enriched shoots. The structure is not fully explained, and further work is needed to test its extents. The gold mineralization may expand up-dip of hole R-10-05.
All results are drill intercepted sample lengths, not true widths, the true width of the mineralization at this point in time is unknown and the orientation of the mineralization is unknown.
Table 4: Significant Results from 2010 Drilling
| DDH | From | To | Width | Au g/t |
| R-10-01 | 49.5 | 50.5 | 1 | 3.67 |
| R-10-01 | 58.4 | 60 | 1.6 | 4.80 |
| incls | 58.4 | 58.8 | 0.4 | 18.85 |
| R-10-01 | 84 | 85 | 1 | 2.85 |
| R-10-01 | 97.5 | 98.5 | 1 | 2.45 |
| R-10-01 | 110.75 | 112.5 | 1.75 | 3.15 |
| R-10-05 | 113 | 114 | 1 | 0.61 |
| R-10-05 | 127 | 128 | 1 | 0.49 |
See the technical report prepared by Todd Keast, P. Geo., for further details on the Property.
Todd Keast, P. Geo., carried out an independent review of the Raney Township Gold Property (the ‘Property’), in northern Ontario. The author conducted a site visit, reviewed available exploration results and prepared this independent technical report (the ‘Report’) in accordance with the requirements of National Instrument 43-101 (‘NI 43-101’) and Form 43-101F1 (Standards of Disclosure for Mineral Properties) to be a comprehensive review of the exploration activities on the property, and, if warranted, to provide recommendations for future work. For the purposes of NI 43-101, the Property is considered an early-stage exploration property.
Copyright 2020 Rockridge Resources Ltd.