TSX-V: ROCK Last: $0.04 Change: 0.00 OTCQB: RRRLF Last: $0.02 Change: -0.00

Raney Gold Project

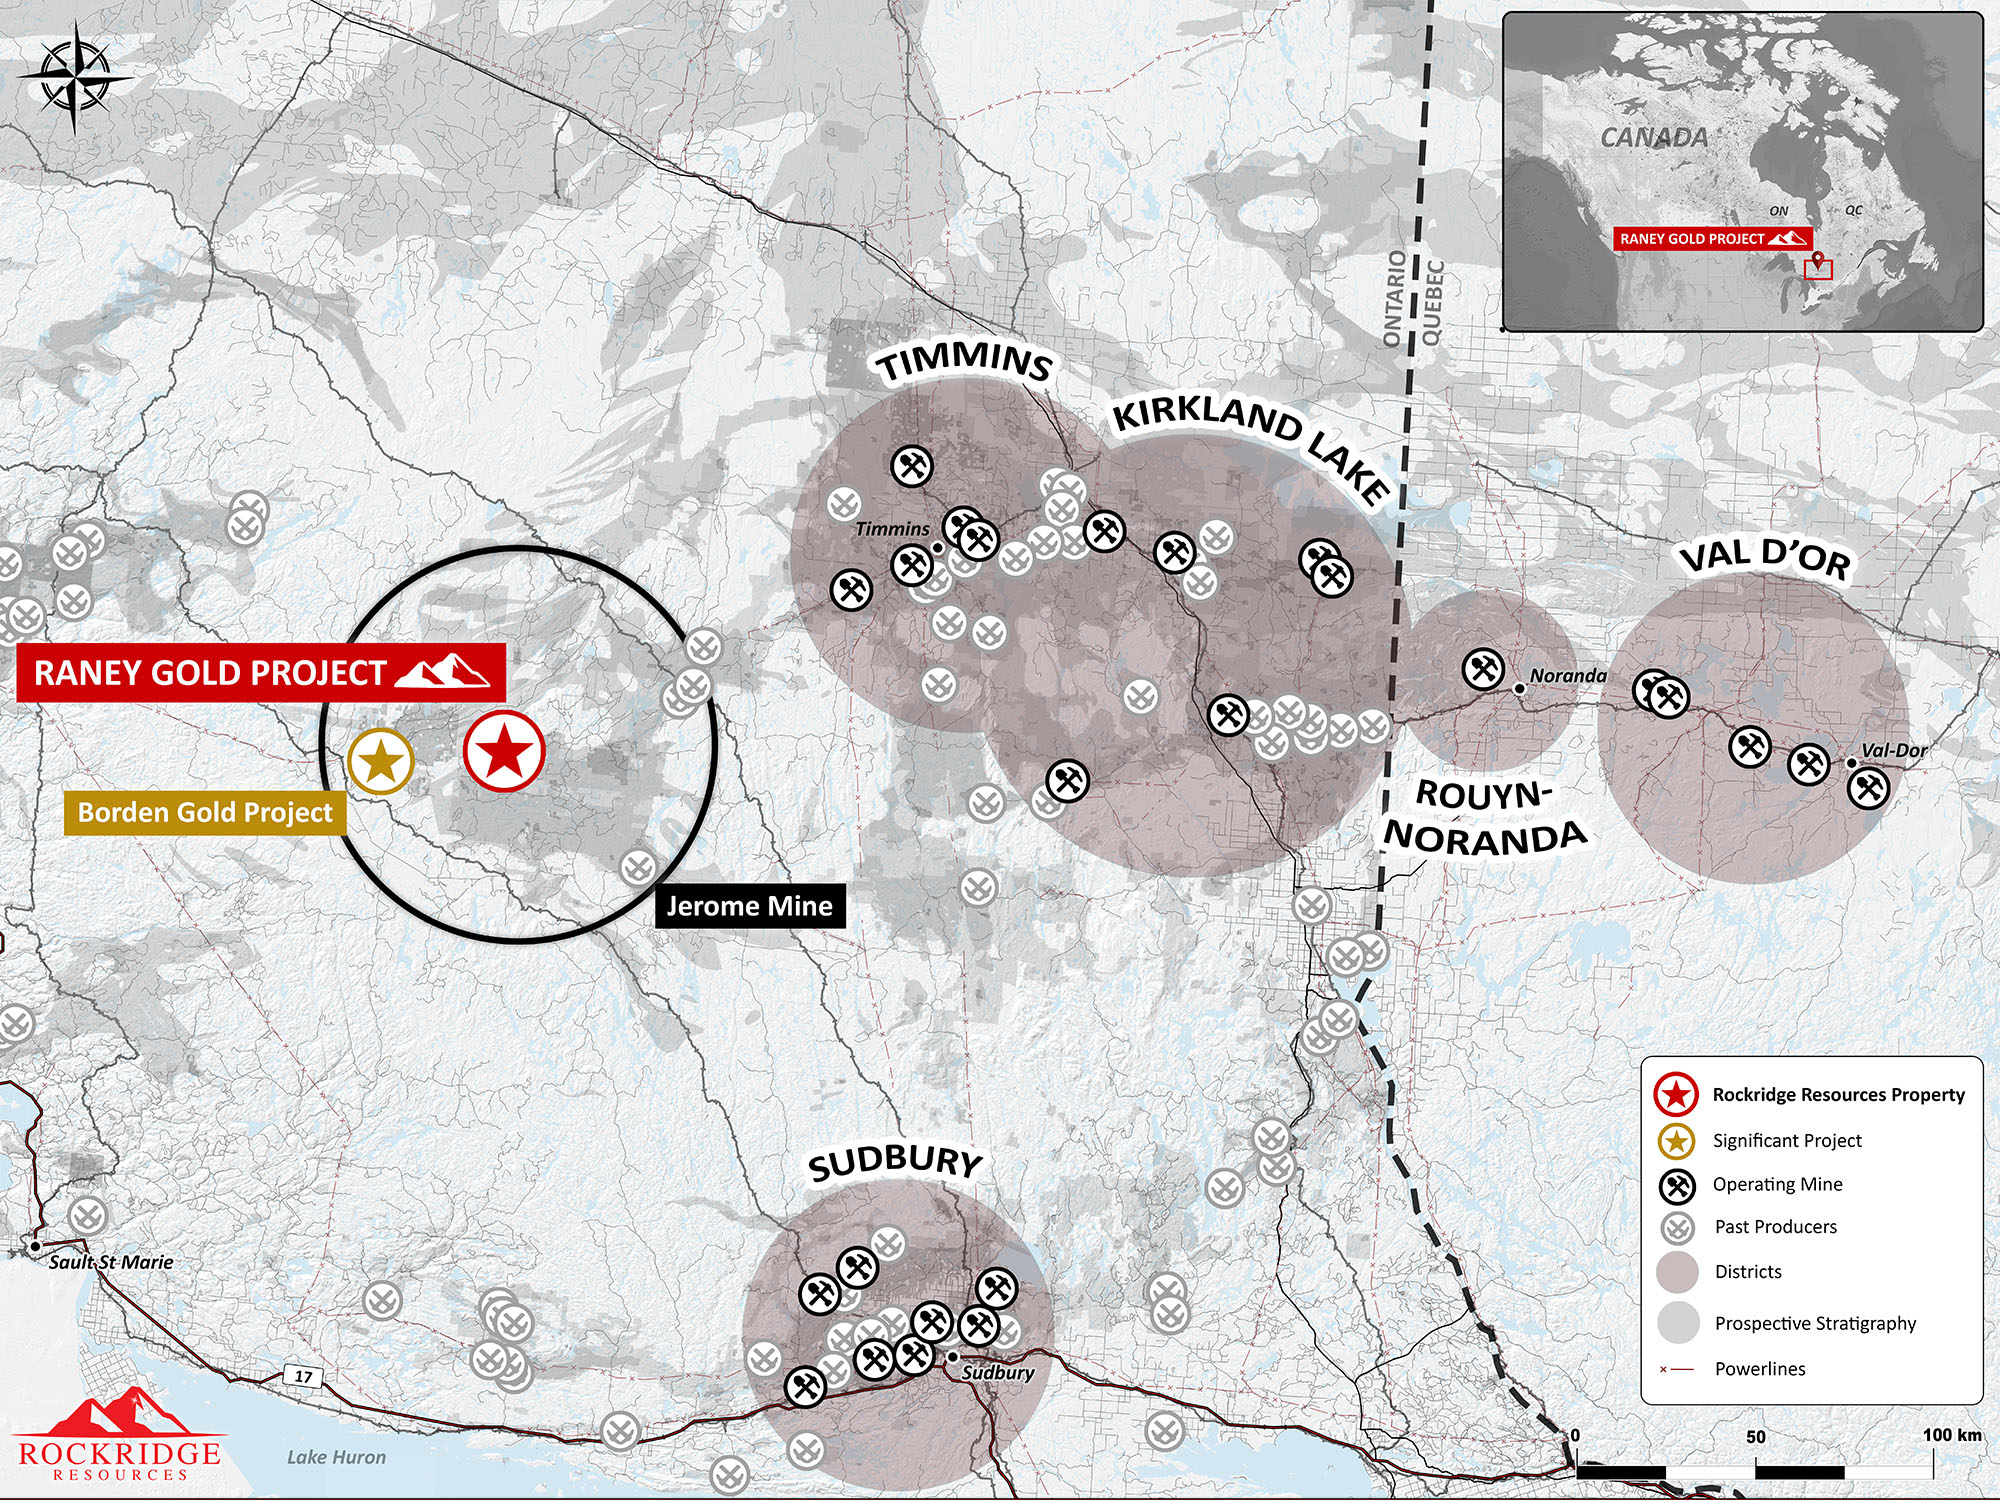
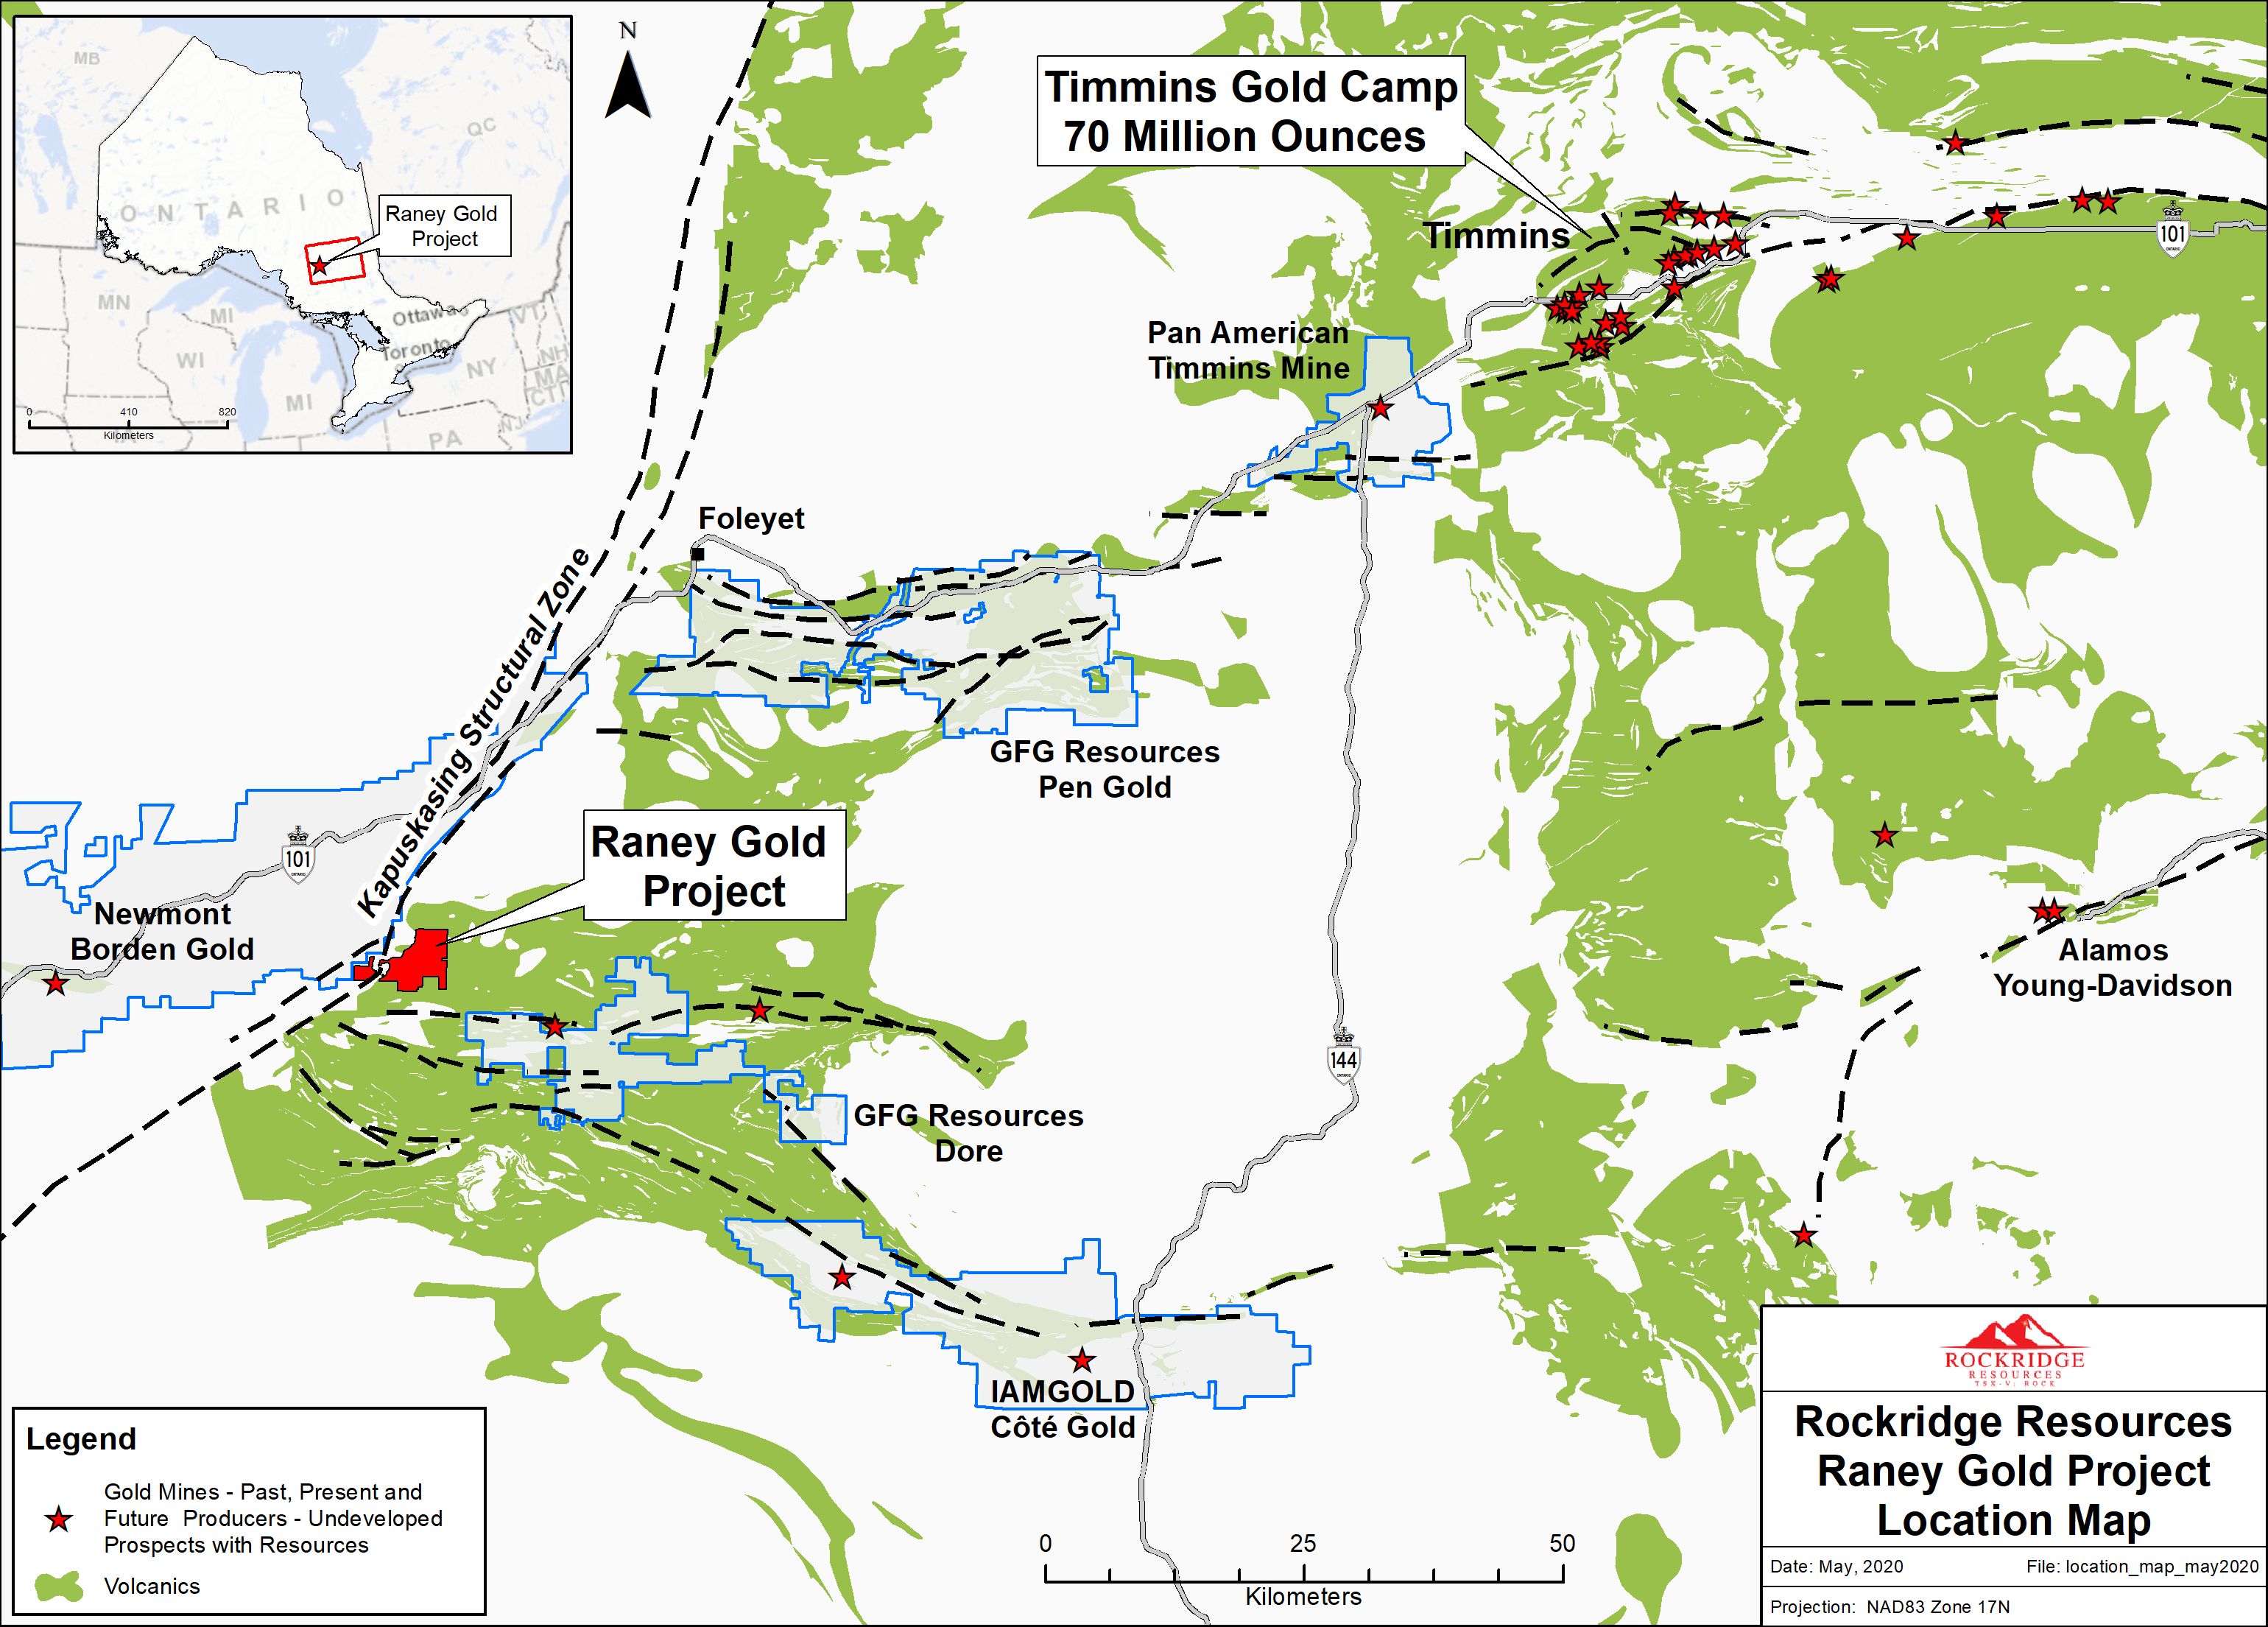
The Property is located in Ontario, 110 km southwest of the city of Timmins, and is accessible by highway and secondary roads (Figure 1).

Figure 1: Raney Property – Location
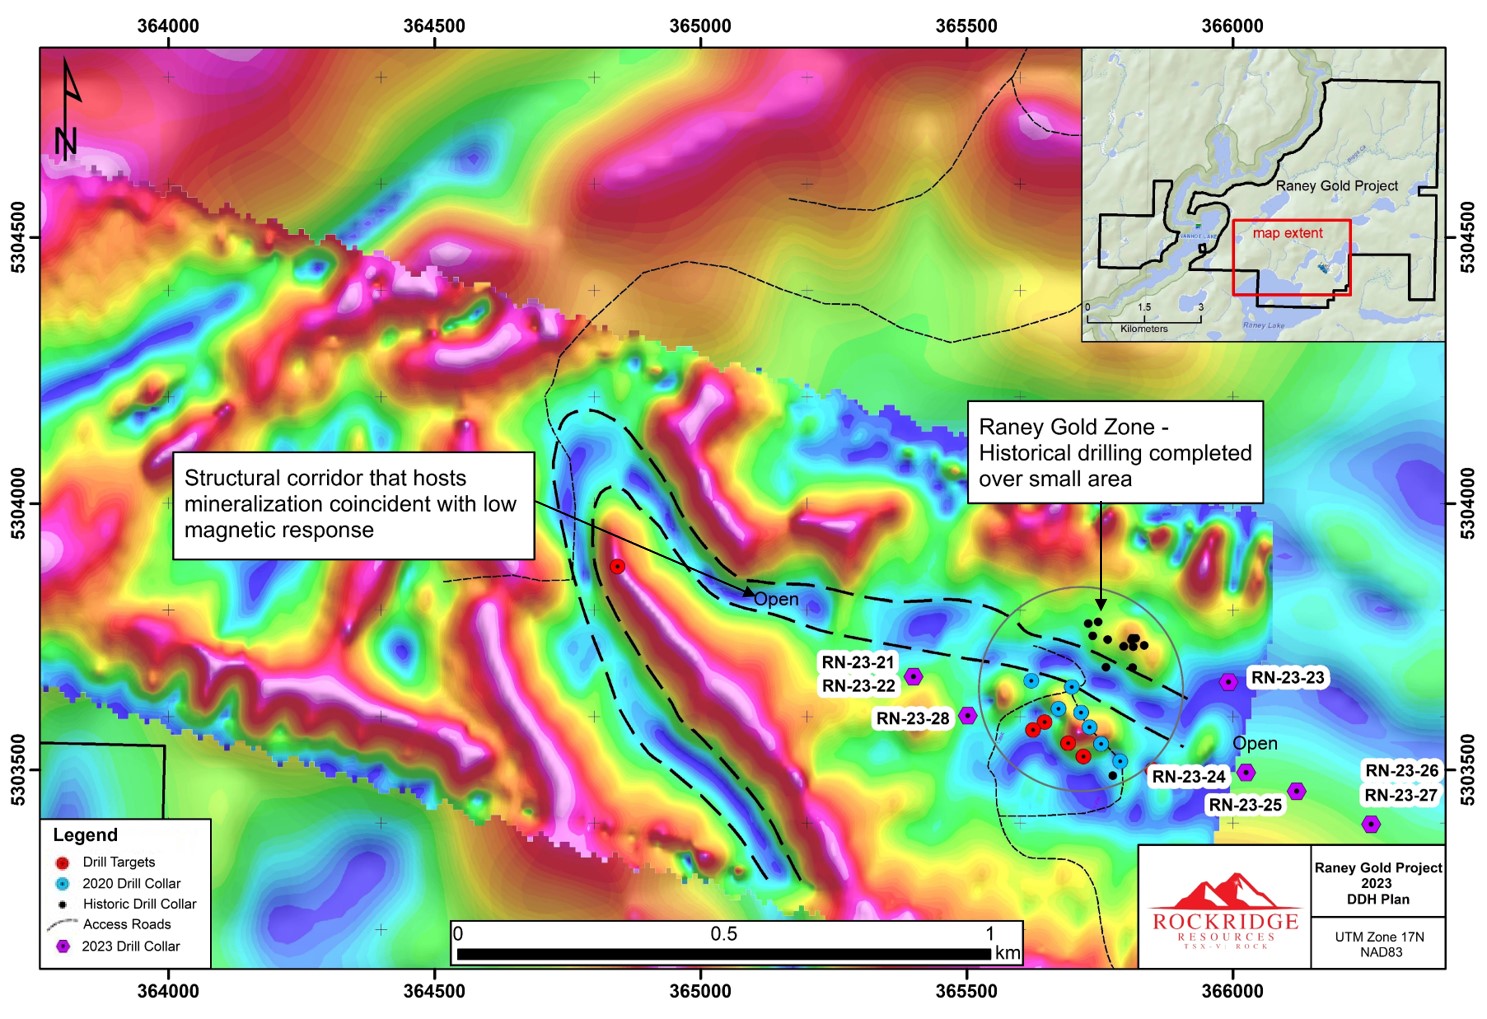
Raney Property - Location

Highlights:

  • Rockridge owns a 100% interest in the Raney Gold Project
  • The Raney Gold Project is a large prospective gold property covering ~2,800 hectares located ~110 km southwest of the prolific gold district of Timmins, ON
  • Project is in the Archean Swayze Greenstone Belt which is a part of the Abitibi Greenstone Belt which hosts the world class Timmins and Kirkland Lake lode gold mining camps
  • Limited historical exploration campaigns conducted on the Property; the last exploration activities prior to the 2020 program occurred ~10 years ago when gold prices were in the US$900/oz. range
  • Early 2020 exploration program followed-up on historical drill results (best historic intercept returned ~6.5 g/t gold over 8 metres, uncut)
  • Early 2020 drilling program entailed 2,070 metres in nine diamond drill holes; highlight intercept in hole RN 20-06 of 28 g/t gold over 6 metres (uncut) at a shallow vertical level of 95 metres
  • The program tested the mineralized gold system along a strike extent of 225 metres, with the deepest hole at the 260-metre level
  • Gold mineralization is associated with broad intervals of higher concentrations of narrow quartz veins; the quartz veins are hosted in a steeply dipping alteration zone dominated by intermediate volcanic rocks consisting of lapilli tuffs and bedded argillites, with lamprophyre dikes
  • The broad structural corridor that hosts the mineralization is open for expansion; historic mapping and surface sampling data show that it may extend over several hundred metres, with no drilling completed over a large extent of this corridor
  • A notable disruption in the airborne magnetic data approximately 2 km west of the recent drilling and in line with the projected structural corridor provides a compelling target area for future exploration
  • Winter 2020/2021 drilling program entailed 2,965 metres in eleven diamond drill holes to evaluate the down-plunge and strike extent of the Raney Gold Zone
  • Property has excellent access and infrastructure; accessible by paved and forestry roads
  • Newmont’s newest gold mine (Borden) is located ~35km west and IAMGOLD’s Cote development project is ~75km southeast
  • Rockridge is currently planning for an initial 2023 drill program that will consist of a minimum 2,500m of drilling in 10-12 diamond drill holes with the potential to be expanded

2020 Drill Program Summary:

A total of 2,070 metres in nine diamond drill holes were completed during the program to assess the potential of the Raney Gold Project (Table 1).

DDH # East (UTM) North (UTM) Elev Az Dip Depth (m)
RN-20-01 365715 5303608 391 25 -45 179
RN-20-02 365715 5303608 391 25 -65 276
RN-20-03 365789 5303516 391 25 -45 291
RN-20-04 365753 5303549 391 25 -45 306
RN-20-05 365753 5303549 391 25 -58 320
RN-20-06 365673 5303615 391 25 -45 176
RN-20-07 365731 5303580 391 30 -45 237
RN-20-08 365698 5303656 387 25 -45 113
RN-20-09 365622 5303667 387 30 -45 174

Detailed logging and sampling of the early 2020 drill program core has been completed. A summary of assay results are reported below:

  • Hole RN 20-01 returned 0.83 g/t Au over 8.9 m from 126.1 m to 135 m
  • Hole RN 20-02 returned 0.63 g/t Au over 8.5 m from 77.5 m to 86 m; and 1.39 g/t over 13 m from 102 m to 115 m, including 3.72 g/t over 3 m from 103 m to 106 m
  • Hole RN 20-03 returned 0.52 g/t Au over 23 m from 239 m to 262 m
  • Hole RN 20-04 - no significant assays
  • Hole RN 20-05 returned 6.45 g/t Au over 1 m from 110 m to 111 m; and 1.28 g/t over 2 m from 295 m to 297 m
  • Hole RN 20-06 returned 27.98 g/t Au over 6 m from 125 m to 131 m, including 2.93 g/t over 1 m from 125 m to 126 m, 71.28 g/t over 2.3 m from 128.7 m to 131 m, and 326 g/t over 0.5 m from 130.5 m to 131 m
  • Hole RN 20-07 returned 0.62 g/t Au over 5.0 m from 35.0 m to 40.0 m; 0.69 g/t Au over 5.0 m from 89.0 m to 94.0 m; 0.57 g/t Au over 7 m from 112.0 m to 119.0 m, including 1.17 g/t Au over 3.0 m from 114.0 m to 117.0 m
  • Hole RN 20-08 returned 0.39 g/t Au over 6.0 m from 12.0 m to 18.0 m; and 0.7 g/t Au over 3 m from 76.5 m to 79.5 m
  • Hole RN 20-09 returned 0.42 g/t Au over 4.0 m from 51.0 m to 55.0 m; and 0.49 g/t Au over 2.0 m from 108.5 m to 110.5 m

True widths are not estimated at this time. 

Assay Tables for Holes 1-9

Figure 2: Raney Property – 2020 Drill Hole Location Map

Raney Property - 2020 Drill Hole Location Map

The Spring 2020 drill program focused on the main zone over a strike extent of approximately 225 metres that produced the best historic intercept of 6.5 g/t gold over 8 metres. The deepest hole of the current program tested down to the 260-metre level.

Silicification and minor carbonate alteration were recognized, however gold mineralization appears to be closely related to intervals of high quartz vein density. The quartz veins are hosted in a steeply dipping alteration zone dominated by intermediate volcanic rocks consisting of lapilli tuffs and bedded argillites, with lamprophyre dikes. The quartz veins crosscut and run parallel to a weak fabric, and range in thickness from 0.5 cm to 20 cm in width.

A zone of increased vein density has been noted where the historic visible gold intercepts occur. The high-grade intercept of 28 g/t over 6 metres from the Spring 2020 program was the fourth drill hole on the Property to intercept visible gold, and all these occurrences were in the main zone near the 100-metre level.

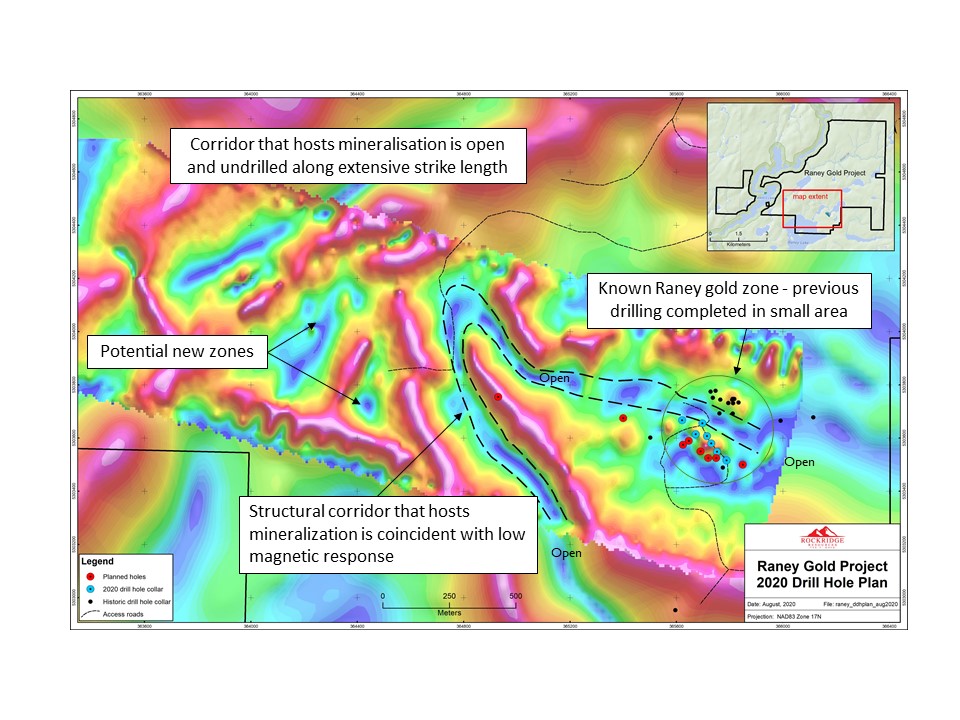
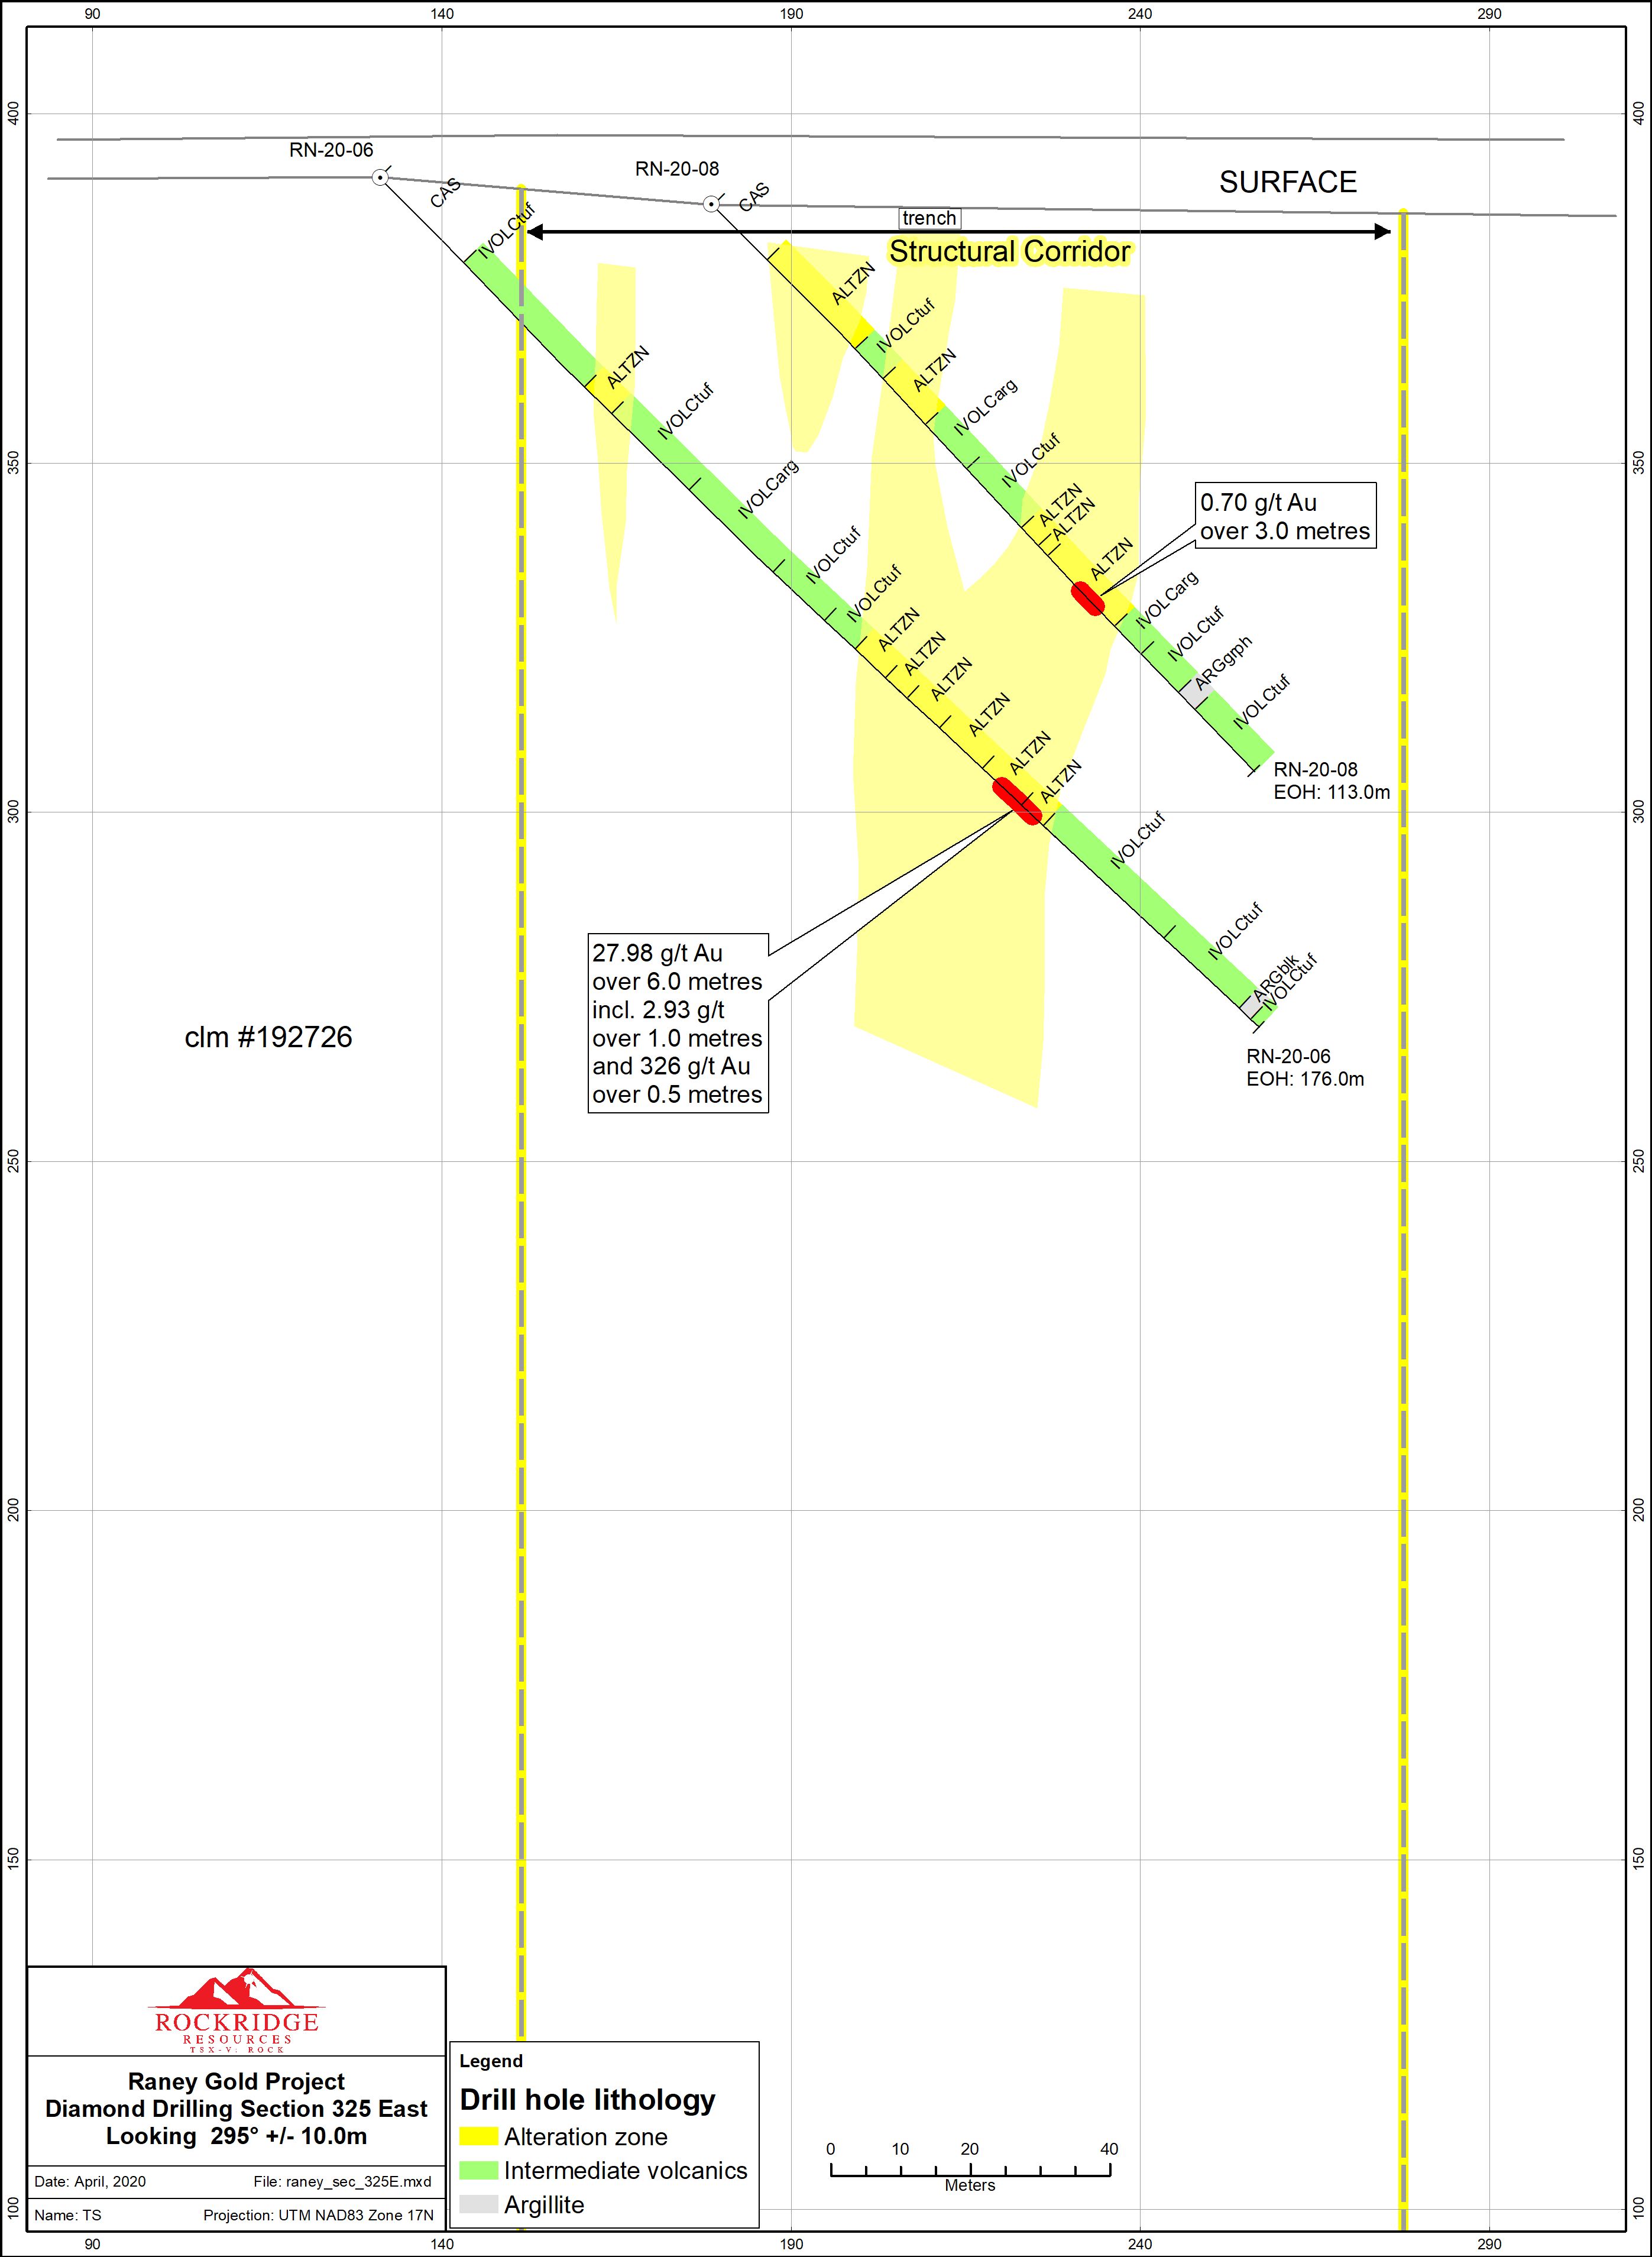
The broad structural corridor that hosts the mineralization is up to 125 metres wide and extends well beyond the area tested by drilling. Historic mapping and surface sampling data show that the corridor may extend over several hundred metres. No drilling has been conducted along this corridor except for the ~225-metre-long main zone (Figure 3).

A notable disruption in the airborne magnetic data approximately 2 km west of the past drilling is being tested in the current drill program. The target is in line with the projected structural corridor identified by historical results.

Figure 3: Raney Property – 2020 Plan Map Showing Exploration Potential Along Structural Corridor

Raney Property - 2020 Plan Map Showing Exploration Potential Along Structural Corridor

Figure 4: Raney Property – 2020 Plan Map Showing Exploration Potential Along Structural Corridor

Raney Property - 2020 Plan Map Showing Exploration Potential Along Structural Corridor

Raney Property - Location

Winter 2020/2021 Drill Program Summary:

A total of 2,965 metres in eleven diamond drill holes were completed during the program to evaluate the down-plunge and strike extent of the Raney Gold Zone.

Drill UTM UTM Elevation Azimuth Dip Depth
 Hole East North (m)     (m)
RN-20-10 365644 5303587 397 25 -45 210
RN-20-11 365633 5303579 397 25 -60 273
RN-20-12 365633 5303579 397 25 -52 240
RN-20-13 365691 5303550 387 25 -47 225
RN-20-14 365691 5303550 387 25 -67 336
RN-20-15 365858 5303482 387 25 -60 330
RN-20-16 365850 5303500 387 30 -60 481
RN-20-17 365568 5303589 387 180 -45 102
RN-20-18 365400 5303675 387 0 -45 252
RN-20-19 364844 5303882 387 55 -45 276
RN-20-20 364844 5303882 387 245 -45 240

A summary of assay results for nine holes are reported below:

  • Hole RN 20-10 returned 1.37 g/t Au over 3.5m from 157m to 160.5m
  • Hole RN 20-11 returned 2.18 g/t Au over 5.7m from 153.8m to 159.5m; and 2.68 g/t Au over 0.8m from 250.7m to 251.5m
  • Hole RN 20-12 returned 1.38 g/t Au over 6.5m from 144.5m to 151.0m; and 1.27 g/t Au over 4.0m from 211.5m to 215.5m
  • Hole RN 20-13 returned 2.5 g/t Au over 13.0m from 133.0m to 146.0m; including 3.41 g/t Au over 9.0m from 135.0m to 144.0m and including 9.6 g/t over 2.0m from 135.0m to 137.0m
  • Hole RN 20-14 returned 1.97 g/t Au over 2.0m from 248.5m to 250.5m
  • Hole RN 20-15 and hole RN 20-17 - no significant values
  • Hole RN 20-16 returned 2.21 g/t Au over 1.0m from 387.0m to 388.0m
  • Hole RN-20-17 was drilled to test the feldspar porphyry and a high-grade surface gold showing and intersected anomalous gold grades
  • Hole RN 20-18 returned 1.36 g/t Au over 9.0m from 141.0m to 150.0m; including 1.67 g/t Au over 7.0m from 141.0m to 148.0m and including 2.1 g/t Au over 4.0m from 141.0m to 145.0m
  • Holes RN-20-19 and RN-20-20 were large step outs approximately 1,000 metres west of the main Raney Gold Zone where no prior drilling had been conducted. Both holes did not return any significant gold values. True widths are not estimated at this time.

True widths are not estimated at this time.

The drill program was designed to evaluate a number of exploration ideas/concepts including testing the down plunge and depth continuity of high-grade gold mineralization intersected in previously drilled holes; testing the eastward and westward continuity of the Raney Gold Zone as suggested by a well-defined magnetic low signature along strike as identified from a drone survey; testing a relatively underexplored feldspar porphyry unit, and testing a newly identified magnetic signature along strike to the Raney Gold Zone that exhibited a distinct fold geometry.

2020 Exploration Program Core Photos:

RN 20-06 Core Photo 1

RN 20-06 Core Photo 2: Coarse Visible Gold

RN 20-06 Core Photo 3: Visible Gold

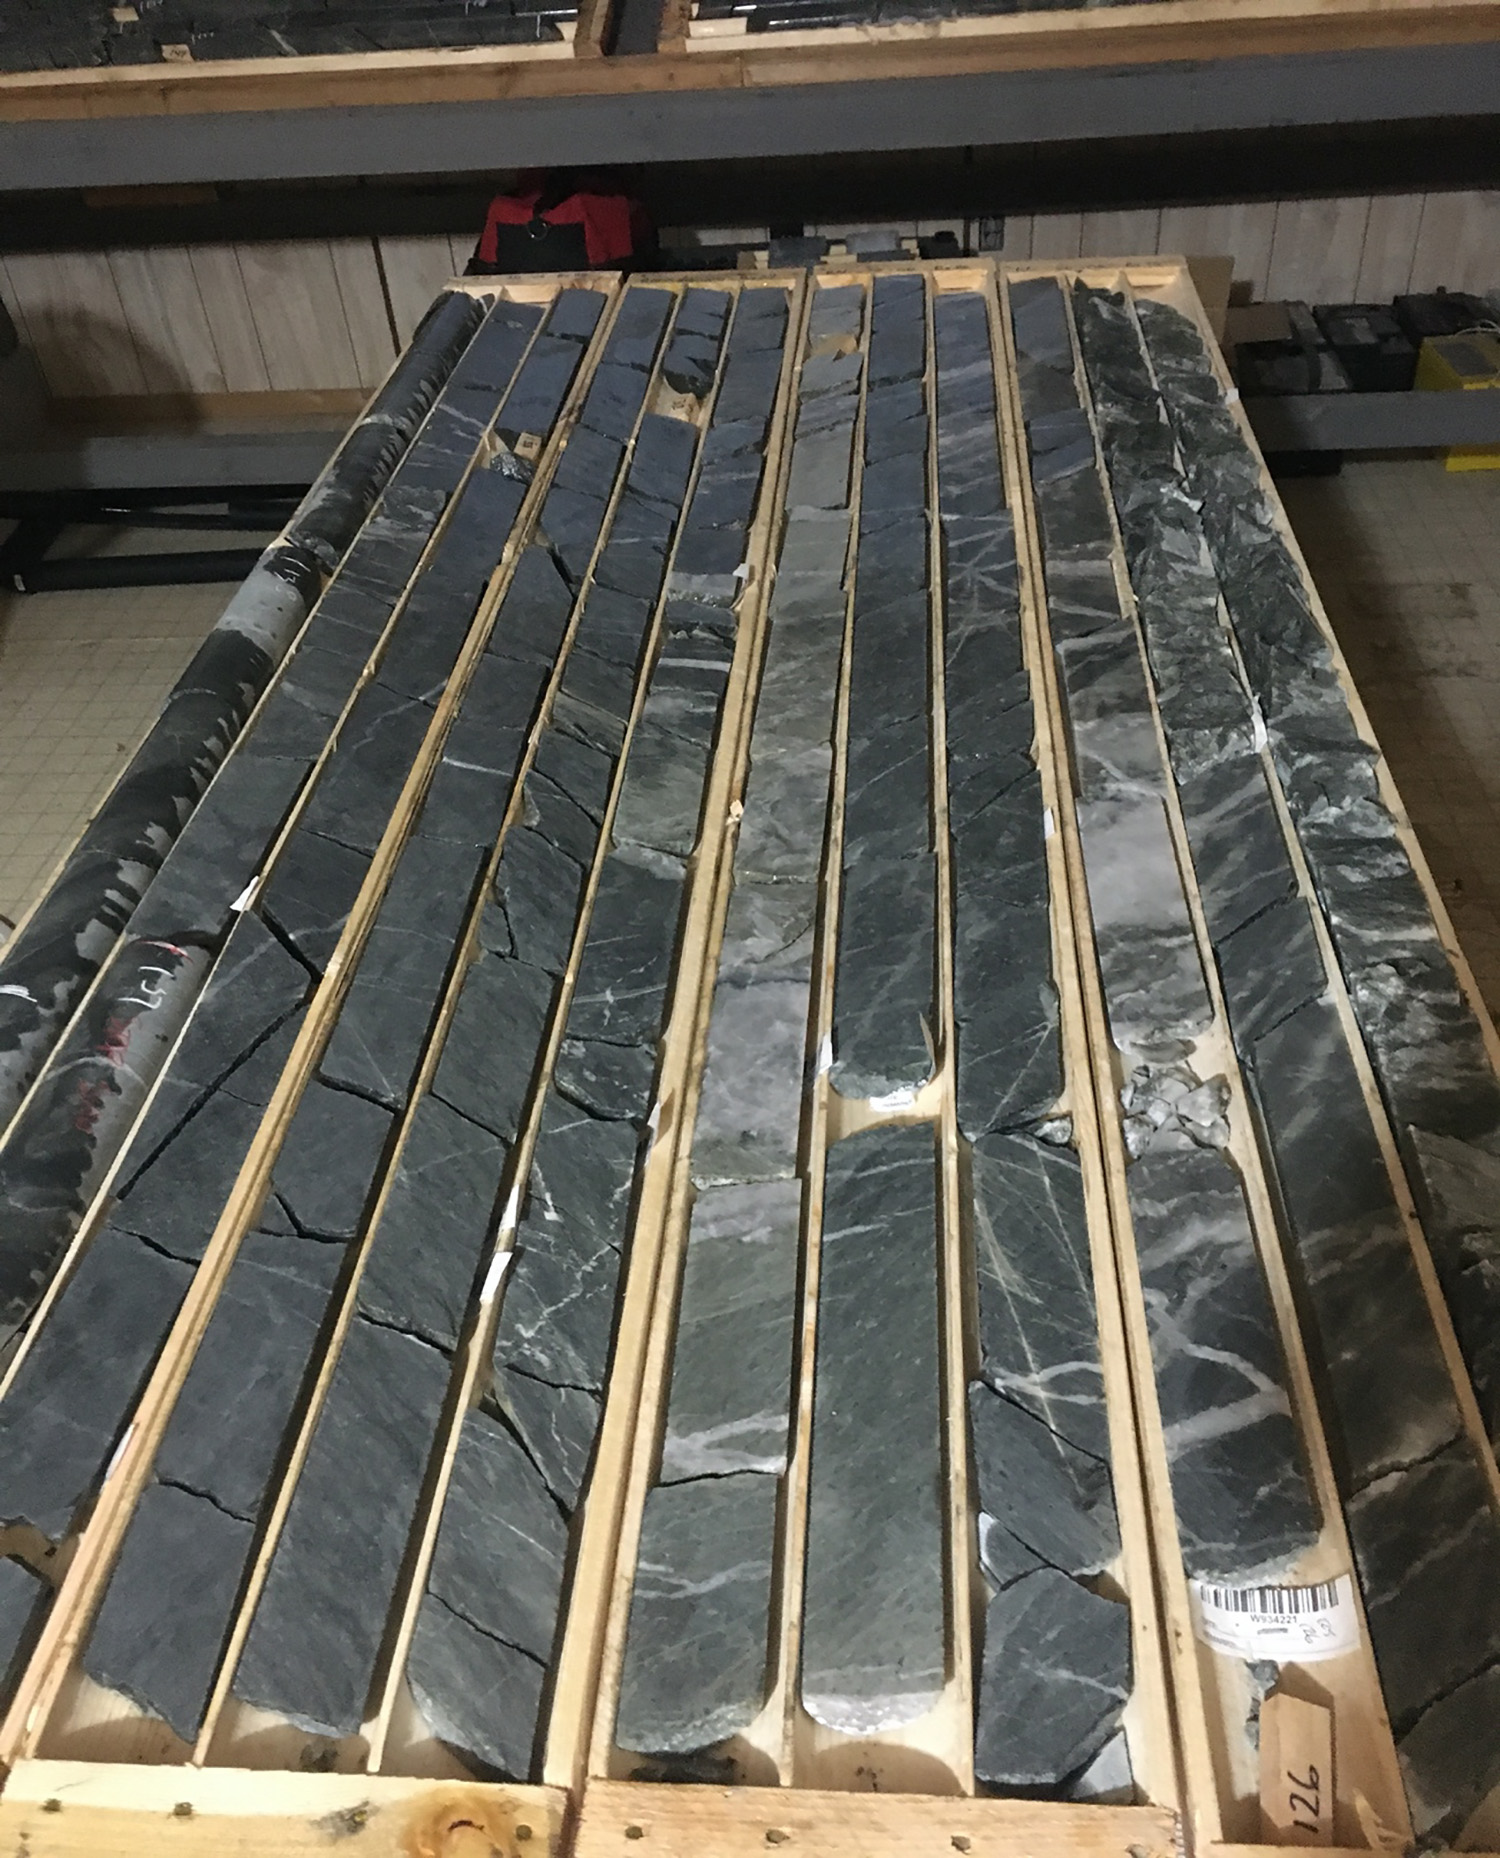
RN 20-06 Core Photo 4

Raney Gold Project Geology and Brief History:

Historical drilling at the Raney Gold Project focused on identifying near-surface gold mineralization along an extensive alteration zone. Three sub-parallel and closely spaced mineralized zones of quartz-carbonate alteration with quartz veining, pyrite, pyrrhotite, and occasionally visible gold were outlined. The drilling to date suggests the possibility of steeply plunging shoots of mineralization with reasonable widths in a broad alteration zone that is open along strike.

Previous exploration on the Property from 1972 to 1991 consisted of prospecting, mapping, sampling, trenching, winkie drilling, ground geophysics, stripping, and some limited diamond drilling. This was followed by exploration work during the 2009 to 2010 period. The best intercept returned from historical drilling was 6.5 g/t gold over 8.0 metres.

The property is underlain by mafic volcanics to the north, and felsic to intermediate volcaniclastics to the south. The felsic volcaniclastics are host to the gold zones. Quartz feldspar porphyry dykes and sills and minor mafic intrusives occur throughout the Property. The porphyries are generally massive but may be sheared and hydrothermally altered and veined in places.

A 100 metre-wide intensely sheared and altered quartz-feldspar porphyry body is located just to the south of the main Raney gold showing. Gold mineralization exposed on the surface and intersected in drill holes on the property is typical of the lode gold class of gold deposit which is the dominant gold deposit type in the Abitibi Greenstone Belt. Gold mineralization on the property is associated with the intensely sheared and altered zones within the felsic tuffs, and higher grades tend to occur where quartz veining is present.

The Property is in the Archean Swayze Greenstone Belt, thought to be the southeast extension of the Abitibi Greenstone Belt, which hosts the world-class Timmins and Kirkland Lake gold districts. Numerous gold occurrences occur throughout the district and several world-class mines have been developed. These deposits are responsible for a significant portion of the world’s cumulative gold production and are often characterized by gold enriched quartz vein systems associated with supracrustal belts in low to medium grade metamorphic terranes. Gold mineralization at the Property is typical of the mesothermal lode gold deposit model.

Rockridge holds a 100% interest in the Raney Gold Project.

Qualified Person:

Todd Keast, P.Geo., a “qualified person” for the purposes of National Instrument 43-101 - Standards of Disclosure for Mineral Projects, and the Raney Gold Project Manager for Rockridge Resources Ltd., has reviewed and approved the scientific and technical disclosure in this summary.

Detailed History of the Property

Exploration in the area is documented from 1932 onwards, and consisted of at least five previous exploration campaigns by companies and prospectors. The Property is part of the Swayze area, which is one of Ontario's historic gold areas and has seen prospecting activities for a variety of metals. There are numerous recent discoveries of gold mineralization within the belt supporting the fact that the district has a rich mineral endowment typical of the Abitibi Orogenic Belt. A nearby past producing gold mine in the Swayze greenstone belt is the Jerome Mine, located southeast of the Property in Osway Township. There are numerous occurrences close to the Property that are undeveloped prospects, with no known reserves. Newmont opened the Borden Mine located ~35 kilometres to the west in 2019.

The earliest documented exploration on the Property was by the Raney Lake Prospecting Syndicate in 1932. A group of 35 claims northeast of Raney Lake was staked, prospected and explored by selective trenching and sampling. Two high-grade (l opt Au) gold-bearing quartz veins were discovered and exposed during this program. The first quartz vein, the “No. 1 showing” was striking easterly and dipping steeply north, and was traced for 100 feet with a maximum width of 2 feet. Host rocks were indicated as arkose and/or impure quartzite. The vein contained minor pyrite and carbonate, native gold was noted in one spot. A second quartz vein, the “No. 2 showing”, was exposed 500 feet southwest of the No. 1 showing. It strikes N60E, was exposed continuously for 100 feet, and averaged 6 inches in width. Host rocks were feldspar porphyry which contained trace pyrite, chalcopyrite, and galena. Native gold was observed in one place. These two veins were originally referred to as the “Thorne-Greaves gold showing” (Furse, 1932).

In 1972, J-Dex Exploration Limited staked 4 claims containing the two gold-bearing veins. Most of the property they worked is south of the present day Raney Property, near the north shore of Denyes Lake. The claims lapsed, but were later staked in 1978 by D.O. Baker. One Winkie drill hole, with a length of 66 m (218 feet), was drilled in the vicinity of the No. l showing (Baker, 1979). The location of this hole is uncertain and no assay results are available.

J-Dex Mining and Exploration acquired claims over the gold showings in 1978, and performed geophysics consisting of a magnetometer and VLF-EM survey. This was followed up with geological mapping and sampling (Caira and Coster, 1984). Assays up to 34.0 g/t Au were reported from the surface sampling. In 1984 a limited Winkie drilling program was completed, totaling 11 drill holes for 615 m (2,017 feet). Seven holes were positioned at three collar locations to test the No. l gold showing. These holes generally cut the vein zone at very shallow depths. Intersections included 4.79 m of 2.16 g/t Au and 2.36 m of 1.21 g/t Au. Four holes were positioned at a single collar location to investigate VLF-EM anomalies located to the northwest of the vein (Caira, 1984). The No. 2 gold showing was not tested during this program.

In 1986 J-Dex Mining and Exploration formed a joint venture with Goldrock Resources and Glen Auden Resources, and they extended the original J-DEX claims to a 72 claim property. Induced Polarization, magnetic, VLF-EM and lithogeochemical surveys were completed over 15 km of grid covering a portion of the present property (Hodges, 1986). The surveying did not include the swampy area immediately to the east of the No l showing.

In 1988 a drilling program was performed to test the IP anomalies, as well as some magnetic anomalies and structures associated with the No. 2 gold showing. A total of thirteen Winkie holes were completed, totaling 375.82 m (1233 feet). Many of the planned targets were never intersected and thus untested. Assay values were not submitted for the drill core samples. The No. l gold showing was not tested in this program (MPH Consulting, 1993).

In 1991 a prospector staked several claims which form part of the current property. The prospectors cleaned out the old trenches over the No. 1 and No. 2 showings, performed sampling of these showings, and completed geological mapping (Salo, 1992). Assays were not reported.

In 1993 Cree Lake Resources Corp. optioned the property and carried out a program of geological mapping, rock sampling and till sampling over a larger group of claims which included most of the present day property. Rock sampling confirmed previously indicated values. A soil geochemistry survey outlined a broad zone of weakly anomalous gold-in-soils over the No. 2 gold showing. The soil program did indicate the No. 2 gold showing had the possibility of some strike extension. The geochemical anomaly over this showing is coincident with IP chargeability anomalies defined during previous exploration and is largely untested (MPH Consulting, 1993). A compilation program by Cree Lake Resources interpreted a gold-bearing alteration envelope surrounding the No. l auriferous quartz vein, and suggested the vein zone was increasing in intensity and potential to the east. Recommendations for a drilling program to test both gold showings were made, however the company did not have the funds to implement the program and no further work was recorded by Cree Lake Resources. In 1993, Induced Polarization surveys were reported to have been completed over portions of the current property, the data has not been located in assessment files.

In 1999 Joe-Anne Salo and William Brereton completed one drill hole on the property; this program was funded by the Ontario Prospectors Assistance Program (OPAP). A total of 251 m (823ft) was drilled on the projected east extension of the historic No. l gold showing. Two zones of irregular quartz-carbonate flooding, patches and veinlets with minor disseminated pyrite were intersected from 127 to 134 m and 148 to 159.5 m. The upper zone returned assay results of 2.50 g/t Au over 1.0 m, while the lower zone assayed 3.37 g/t Au over 6.8 m (Brereton, W., 1999). During this same period of work limited stripping work was carried out over the No. 2 showing. A strong, wide (100 m) shear zone was mapped with white weathered feldspar porphyritic rocks. Systematic sampling was not carried out at this time, further drilling was recommended.

In 2005 Wallbridge Mining Company Ltd. evaluated the property, they compiled previous work and re-logged and sampled the 1999 drill hole. The best assay returned from this sampling was 3.85 g/t Au over 5.9 m within the lower gold zone or No. 2 showing (Oosterman, 2005).

Hinterland Metals Inc. optioned the property in 2007, and from the end of 2007 to mid-2008 completed four drill holes totaling 758 m (Fekete and Simper, 2008). Three of the drill holes tested the No.1 showing, and one of these, RAN07-02, was lost at 99.1 m. The other two drill holes were successful in intercepting two mineralized gold zones over the Main showing. The best results were 2.76 g/t Au and 0.51 g/t Ag over 15.5 m in hole RAN08-04 from the lower zone and 1.62 g/t Au and 0.27 g/t Ag over 1.5 m in hole RAN08-03 from the upper zone. The fourth drill hole tested the No. 2 showing, and did not intercept any mineralization. The drill core is still available, and some of it was re-sampled by MPH Ventures in 2009. The report of work is documented by Fekete and Simper (2008) and a review of this document indicates that industry best practices of standards were employed during the program. No further work was carried out by this company; recommendations included magnetometer and IP surveys, sampling, followed by 6000 m of drilling.

Table 2:  Raney Township Gold Property Previous Drill Holes (pre-2020) - Significant Results

Hole Azimuth Dip Length m   From m To m width m Au g/t Company
DL-1 SSW -60 66.45   45.72 46.02 0.30 3.77 D.O. Baker
          49.07 50.29 1.22 1.71  
84-
15WA
210 -45 64.92   44.78 45.72 0.94 0.41 J-Dex
84-
15WB
210 -70 60.05   17.81 17.98 0.18 5.45 J-Dex
          45.26 46.28 1.01 1.20  
          49.51 51.82 2.31 1.21  
84-
15EA
210 -45 74.68   12.19 13.36 1.17 0.650678 J-Dex
          24.38 25.60 1.22 0.341  
          53.93 54.25 0.33 0.232  
84-
15EB
210 -67 65.84   19.81 22.02 2.21 4.54 J-Dex
        incls 21.03 21.34 0.31 28.77  
          36.70 38.10 1.40 1.54  
          43.59 46.94 3.35 0.89  
84-
30EA
210 -45 56.69   7.42 12.19 4.78 2.54 J-Dex
        incls 10.13 11.28 1.14 5.76  
          49.89 50.90 1.01 0.96  
84-30EB 210 -65 60.66   10.24 14.94 4.70 0.76 J-Dex
        incls 10.24 11.84 1.60 1.03  
        incls 13.77 14.94 1.17 1.17  
          15.90 16.15 0.25 1.37  
84-
30EC
190 -65 55.17   4.57 6.10 1.52 1.51 J-Dex
          8.15 9.14 0.99 6.31  
          19.64 20.98 1.34 1.68  
R-99-1 180 -60 251.00   153.00 159.80 6.80 3.37 W. Brereton
        incls 153.00 155.25 2.25 4.81  
        incls 157.40 159.80 2.40 5.04  
RAN08-
03
180 -75 251.00 Upper 202.90 204.40 1.50 1.62 Hinterland
        incls 202.90 203.70 0.80 2.20  
        Lower 222.50 225.50 3.00 2.05  
        incls 224.50 225.50 1.00 6.04  
RAN08-
04
180 -50 208.00 Upper 80.20 86.20 6.00 0.80 Hinterland
        incls 81.20 82.20 1.00 2.09  
        Lower 109.70 125.20 15.50 2.76  
        incls 109.70 111.40 1.70 13.77  

Figure 10‑1: Plan of 2007, 2008, 2009 and 2010 Drilling Showing Mineralization Trend
Figure 5: Plan of 2007, 2008, 2009 and 2010 Drilling Showing Mineralization Trend

MPH Ventures conducted trenching and sampling, Induced Polarization (IP) surveys, followed by drilling over the Property during the winter of 2009 and 2010. This phase of exploration is discussed below in further detail.

2009 Drill Results

Nine holes were completed in 2009 in three phases by MPH Ventures to follow up on gold-bearing drill intersections in holes 99-01, RAN-08-03, and RAN-08-04.

The first phase of the program involved the completion of three drill holes to test the extent of gold mineralization 25 metres to the east (R-09-06) of hole 99-01, 25 metres to the west (R-09-07) of hole RAN-08-04, and to provide an intersection between the 50 m spacing (R-09-08) of holes 99-01 and RAN-08-04.

Holes R-09-06 and R-09-07 returned anomalous but low gold results over variable widths. Hole R-09-08 returned 7.44 g/t Au over 6.5 metres, and established a 50 metre strike length for gold mineralization, extending from hole 99-01 to RAN-08-04.

The next phase of drilling tested the dip potential of this 50 metre trend. Drill hole R-09-09 and R-09-10 tested the gold mineralization in the up dip direction. The two holes intersected anomalous gold mineralization over narrow widths, the highest grade was 1.1 g/t Au over 2 metres in hole R-09-10.

During the next phase of drilling a larger grid was cut, oriented perpendicular to the known mineralization, such that the zone would be intersected perpendicular to the strike direction of mineralization, alteration, and shearing. Four holes (R-09-11 to R-09-14) were completed, testing the down dip continuity of the alteration zone. Significant gold mineralization was intersected in three of the four holes, and it is important to note that each hole intersected multiple alteration zones which contained mineralization. This recognition of multiple zones and better grades is thought to be a result of drilling the zones perpendicular to their strike and dips. The best intersection was in hole R-09-011 consisting of 3.73 g/t Au over 4.0 m. Drill hole R-09-14 intersected 1.43 g/t Au over 2.25 m, and this hole extended the known mineralization 100 m west of the original discovery. Several sections follow which demonstrate the results of the 2007-2008 Hinterland drilling and the 2009 MPH drilling. Section 5+50 E shows the mineralized zone intersected in holes R-09-07 and R-09-14. This zone is very steeply dipping. Section 6+00 E cuts through the main mineralized showing, and demonstrates that at least two and possibly three parallel mineralized zones are present. Section 6+50 E extends the mineralized zones to the east.

Table 3:  Significant Results from 2009 Drilling

DDH From To Width Au g/t
R-09-06 67.75 68.8 1.05 0.93
R-09-06 119.5 127.0 7.5 1.66
Incls 125.0 127.0 2 2.88
R-09-06 135.5 136.6 1.1 2.71
R-09-07 103.5 104.5 1 0.41
R-09-08 121.0 127.5 6.5 7.44
Incls 124.5 125.5 1.0 37.6
R-09-08 137 139 2 2.12
R-09-08 143 144.5 1.5 0.65
R-09-09 45 46.5 1.5 0.63
R-09-09 110 111 1 0.40
R-09-10 54.5 56.5 2 1.11
R-09-10 57.5 58.5 1 0.69
R-09-10 119 119.7 0.7 0.62
R-09-11 57 61 4 3.73
R-09-11 97 105 8 1.57
Incls 97 99 2 3.42
Incls 103 105 2 2.16
R-09-11 167.8 168.8 1 1.33
R-09-12 95 97.25 2.25 2.85
R-09-12 166 168 2 2.74
Incls 167 168 1 5.29
R-09-14 112.3 113 0.7 0.83
R-09-14 177.5 179.75 2.25 1.43

Figure 10‑2:Section 5+50 E (Kettles, 2011)
Figure 6: Section 5+50 E (Kettles, 2011)

Figure 10‑3:Section 6+00 E (Kettles, 2011)
Figure 7: Section 6+00 E (Kettles, 2011)

Figure 10‑4:Section 6+50 E (Kettles, 2011)
Figure 8:  Section 6+50 E (Kettles, 2011)

2010 Drill Results

The ground IP survey results were used to plan the drilling in 2010. This drilling was designed to test the east and west extensions of the sheared alteration zone and to evaluate the geophysical anomalies. Five holes were completed, totaling 645 m.

Hole R-10-01 was planned to test the extension of the Raney gold structure 100 metres east of the previous drilling, and to test an IP anomaly outlined on L7+00 E. This hole intersected numerous gold intercepts over narrow widths including 18.85 g/t Au over 0.40 metres, 7.08 g/t Au over 0.75 metres, 3.67 g/t Au over 1.0 metre, and 2.85 g/t Au over 1.0 metre. The drilling confirms the eastward continuity of the structure. The other four holes did not intersect significant gold mineralization but sufficiently explained the geophysical anomalies. Hole R-10-05 tested the west extension of the mineralization, and intersected narrow anomalous gold assays. The best intersection was 0.61 g/t Au over 1.0 m. This hole had several narrow intercepts of anomalous gold, and may suggest the zone has narrow gold-enriched shoots. The structure is not fully explained, and further work is needed to test its extents. The gold mineralization may expand up-dip of hole R-10-05.

All results are drill intercepted sample lengths, not true widths, the true width of the mineralization at this point in time is unknown and the orientation of the mineralization is unknown.

Table 4: Significant Results from 2010 Drilling

DDH From To Width Au g/t
R-10-01 49.5 50.5 1 3.67
R-10-01 58.4 60 1.6 4.80
incls 58.4 58.8 0.4 18.85
R-10-01 84 85 1 2.85
R-10-01 97.5 98.5 1 2.45
R-10-01 110.75 112.5 1.75 3.15
R-10-05 113 114 1 0.61
R-10-05 127 128 1 0.49

See the technical report prepared by Todd Keast, P. Geo., for further details on the Property.

Todd Keast, P. Geo., carried out an independent review of the Raney Township Gold Property (the ‘Property’), in northern Ontario. The author conducted a site visit, reviewed available exploration results and prepared this independent technical report (the ‘Report’) in accordance with the requirements of National Instrument 43-101 (‘NI 43-101’) and Form 43-101F1 (Standards of Disclosure for Mineral Properties) to be a comprehensive review of the exploration activities on the property, and, if warranted, to provide recommendations for future work. For the purposes of NI 43-101, the Property is considered an early-stage exploration property.

Copyright 2020 Rockridge Resources Ltd.